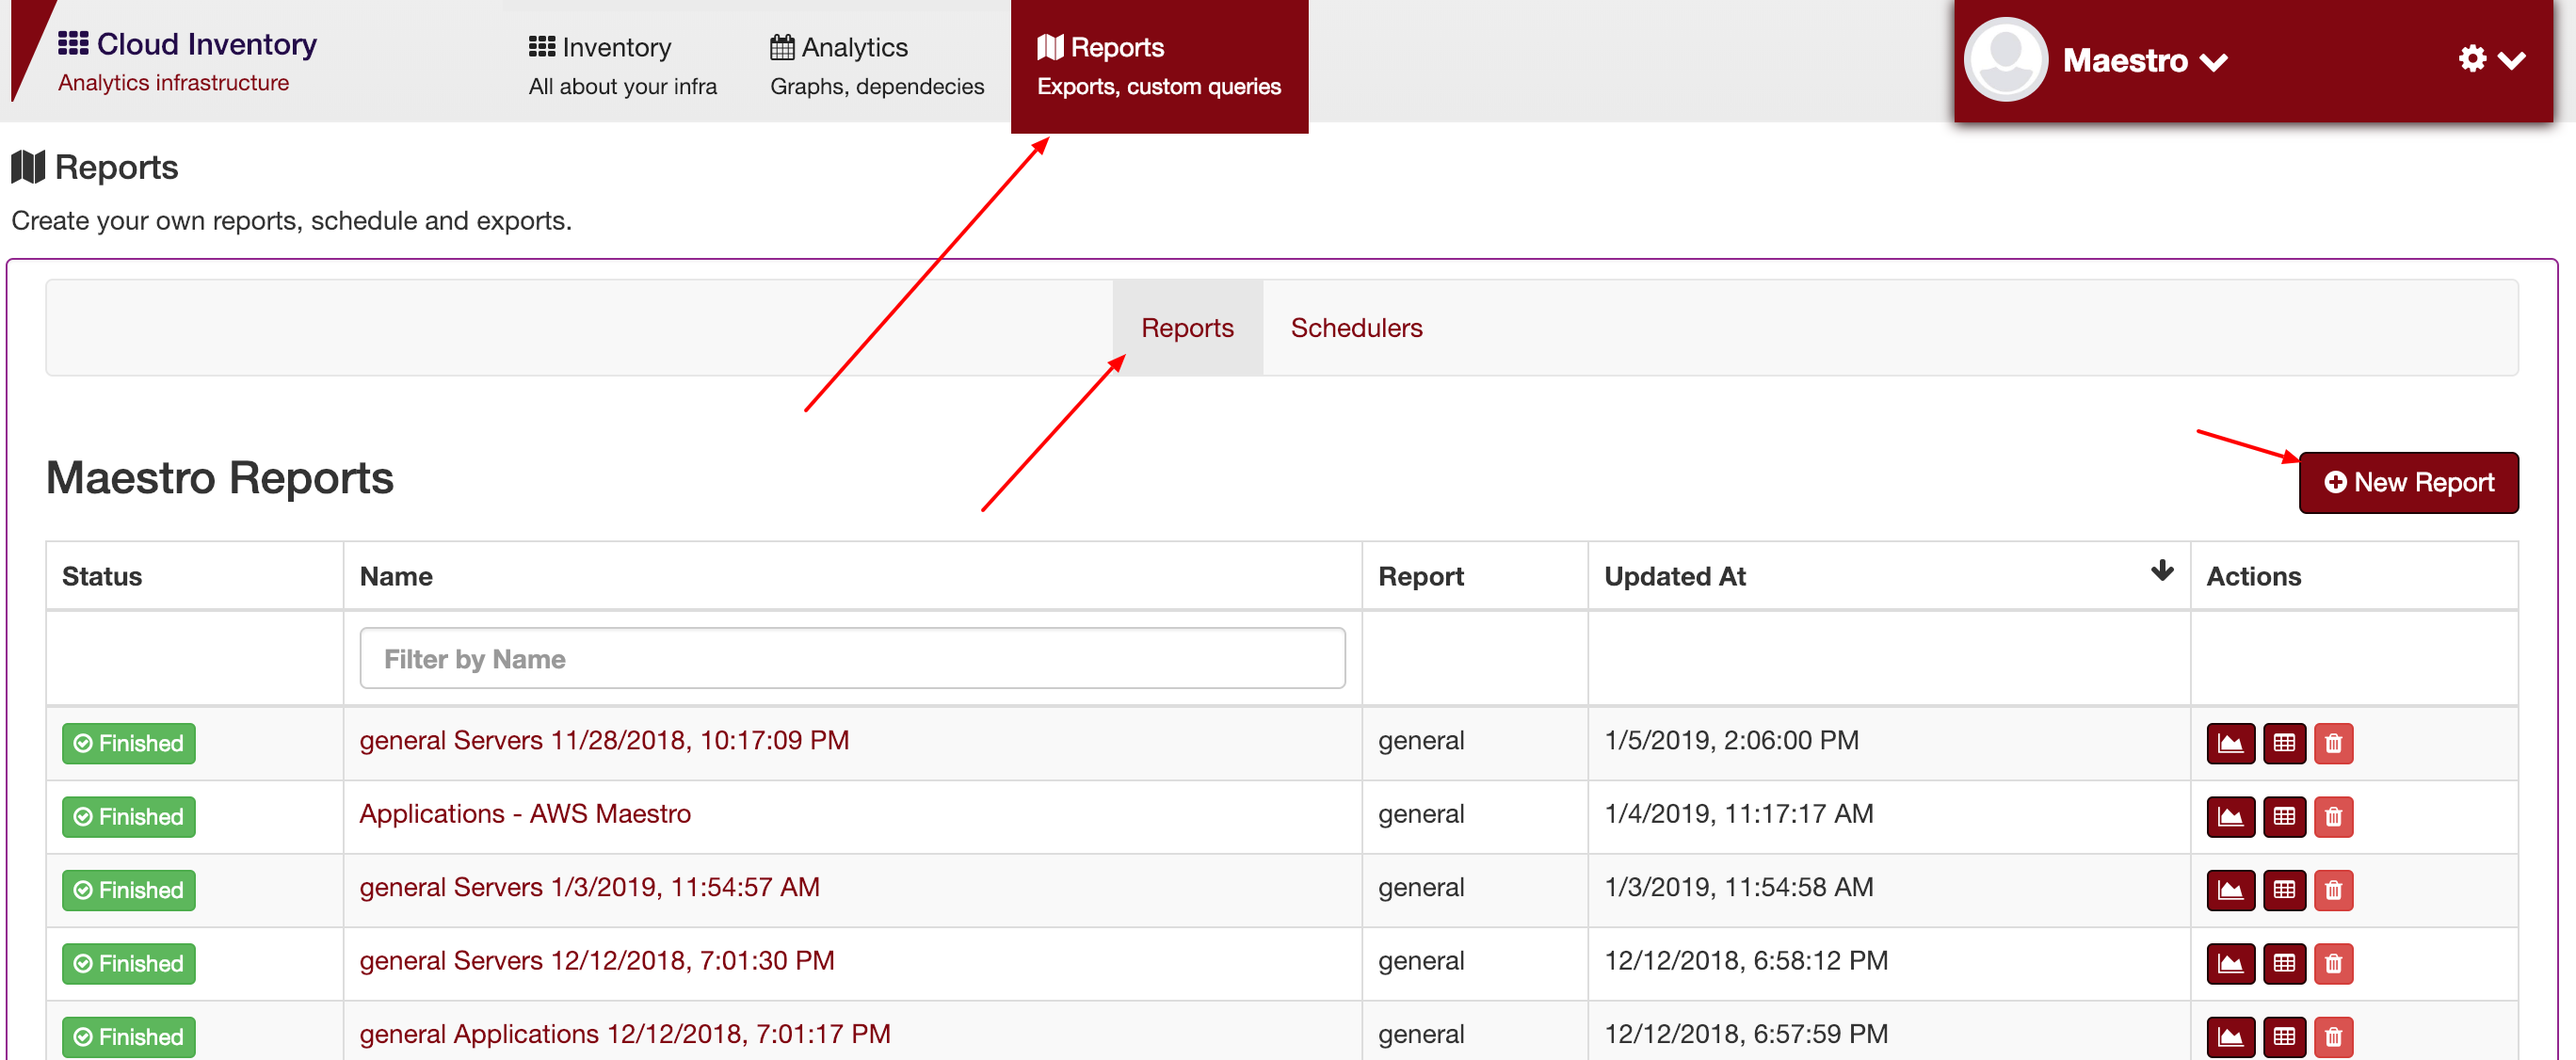
Reports
Maestro has two types of reports.
- Generic: it is a single resource, it can have any filter
- Pivot: It is a multi-resource, you can create a report link clients -> system -> applications -> servers.
Single table report
The general report is a single resource report, you can add any type of filters such as by datacenters, a name, a type, any field can be used as a filter.
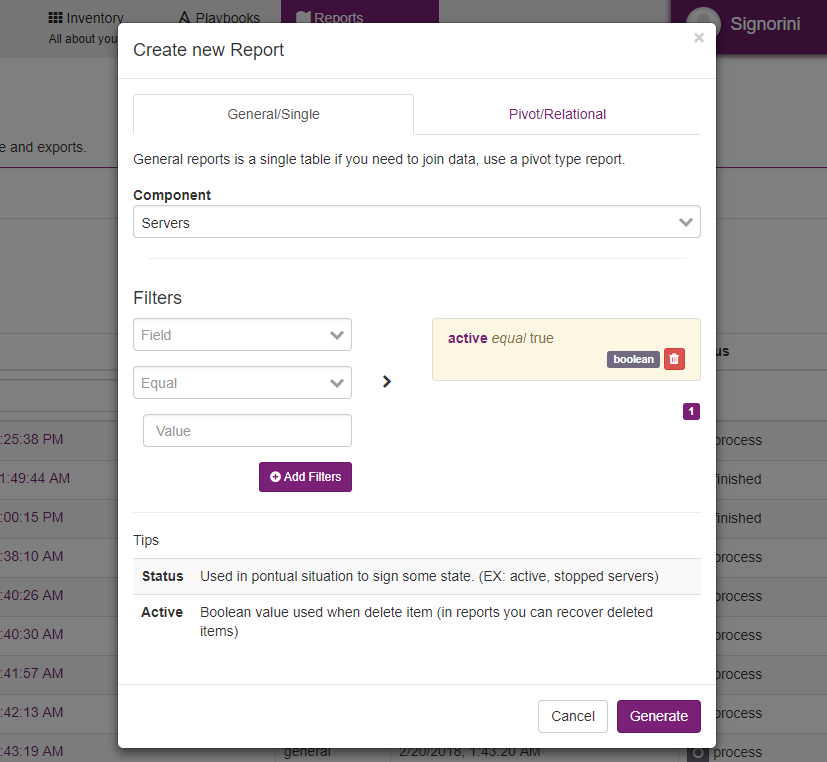
Generic report
Follow some filters examples:
| Hostname/name | string | equal/contains | 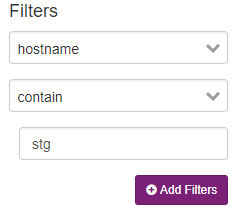
|
| Get all hostname contains stg. | |||
| Updated_at | date | after/equal/before | 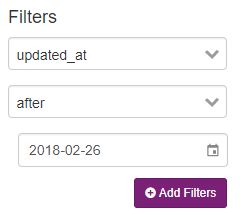
|
| Select only items updated on this month | |||
Pivot table reports
Pivot reports can create reports using multiple resources, and there are well-defined connections between each resource, the order is a client -> system -> app -> servers, you can remove one resource type. However, you need to have a link between them, for example, you can create a report with clients and systems, but can’t to create a client -> servers.
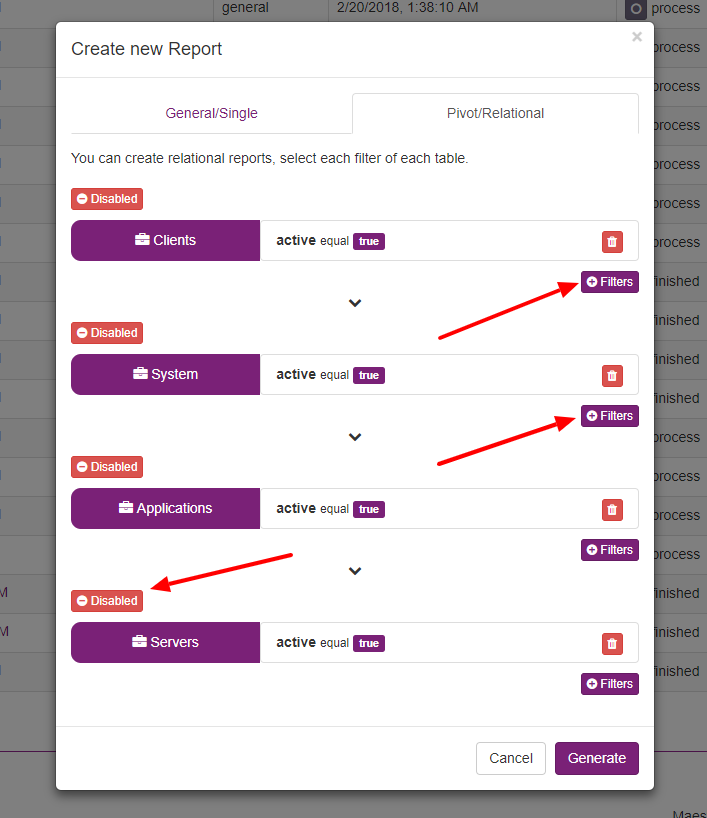
Nesting resources.
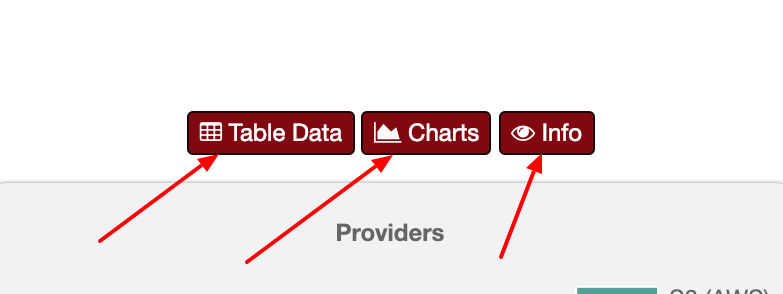
Each report has three pages
- Charts: Visualize the result on charts and diagrams.
- Table: Raw result table.
- Info: Information about the reports, such as status, filters and more.
Report Charts
Reports > Single Report > Charts
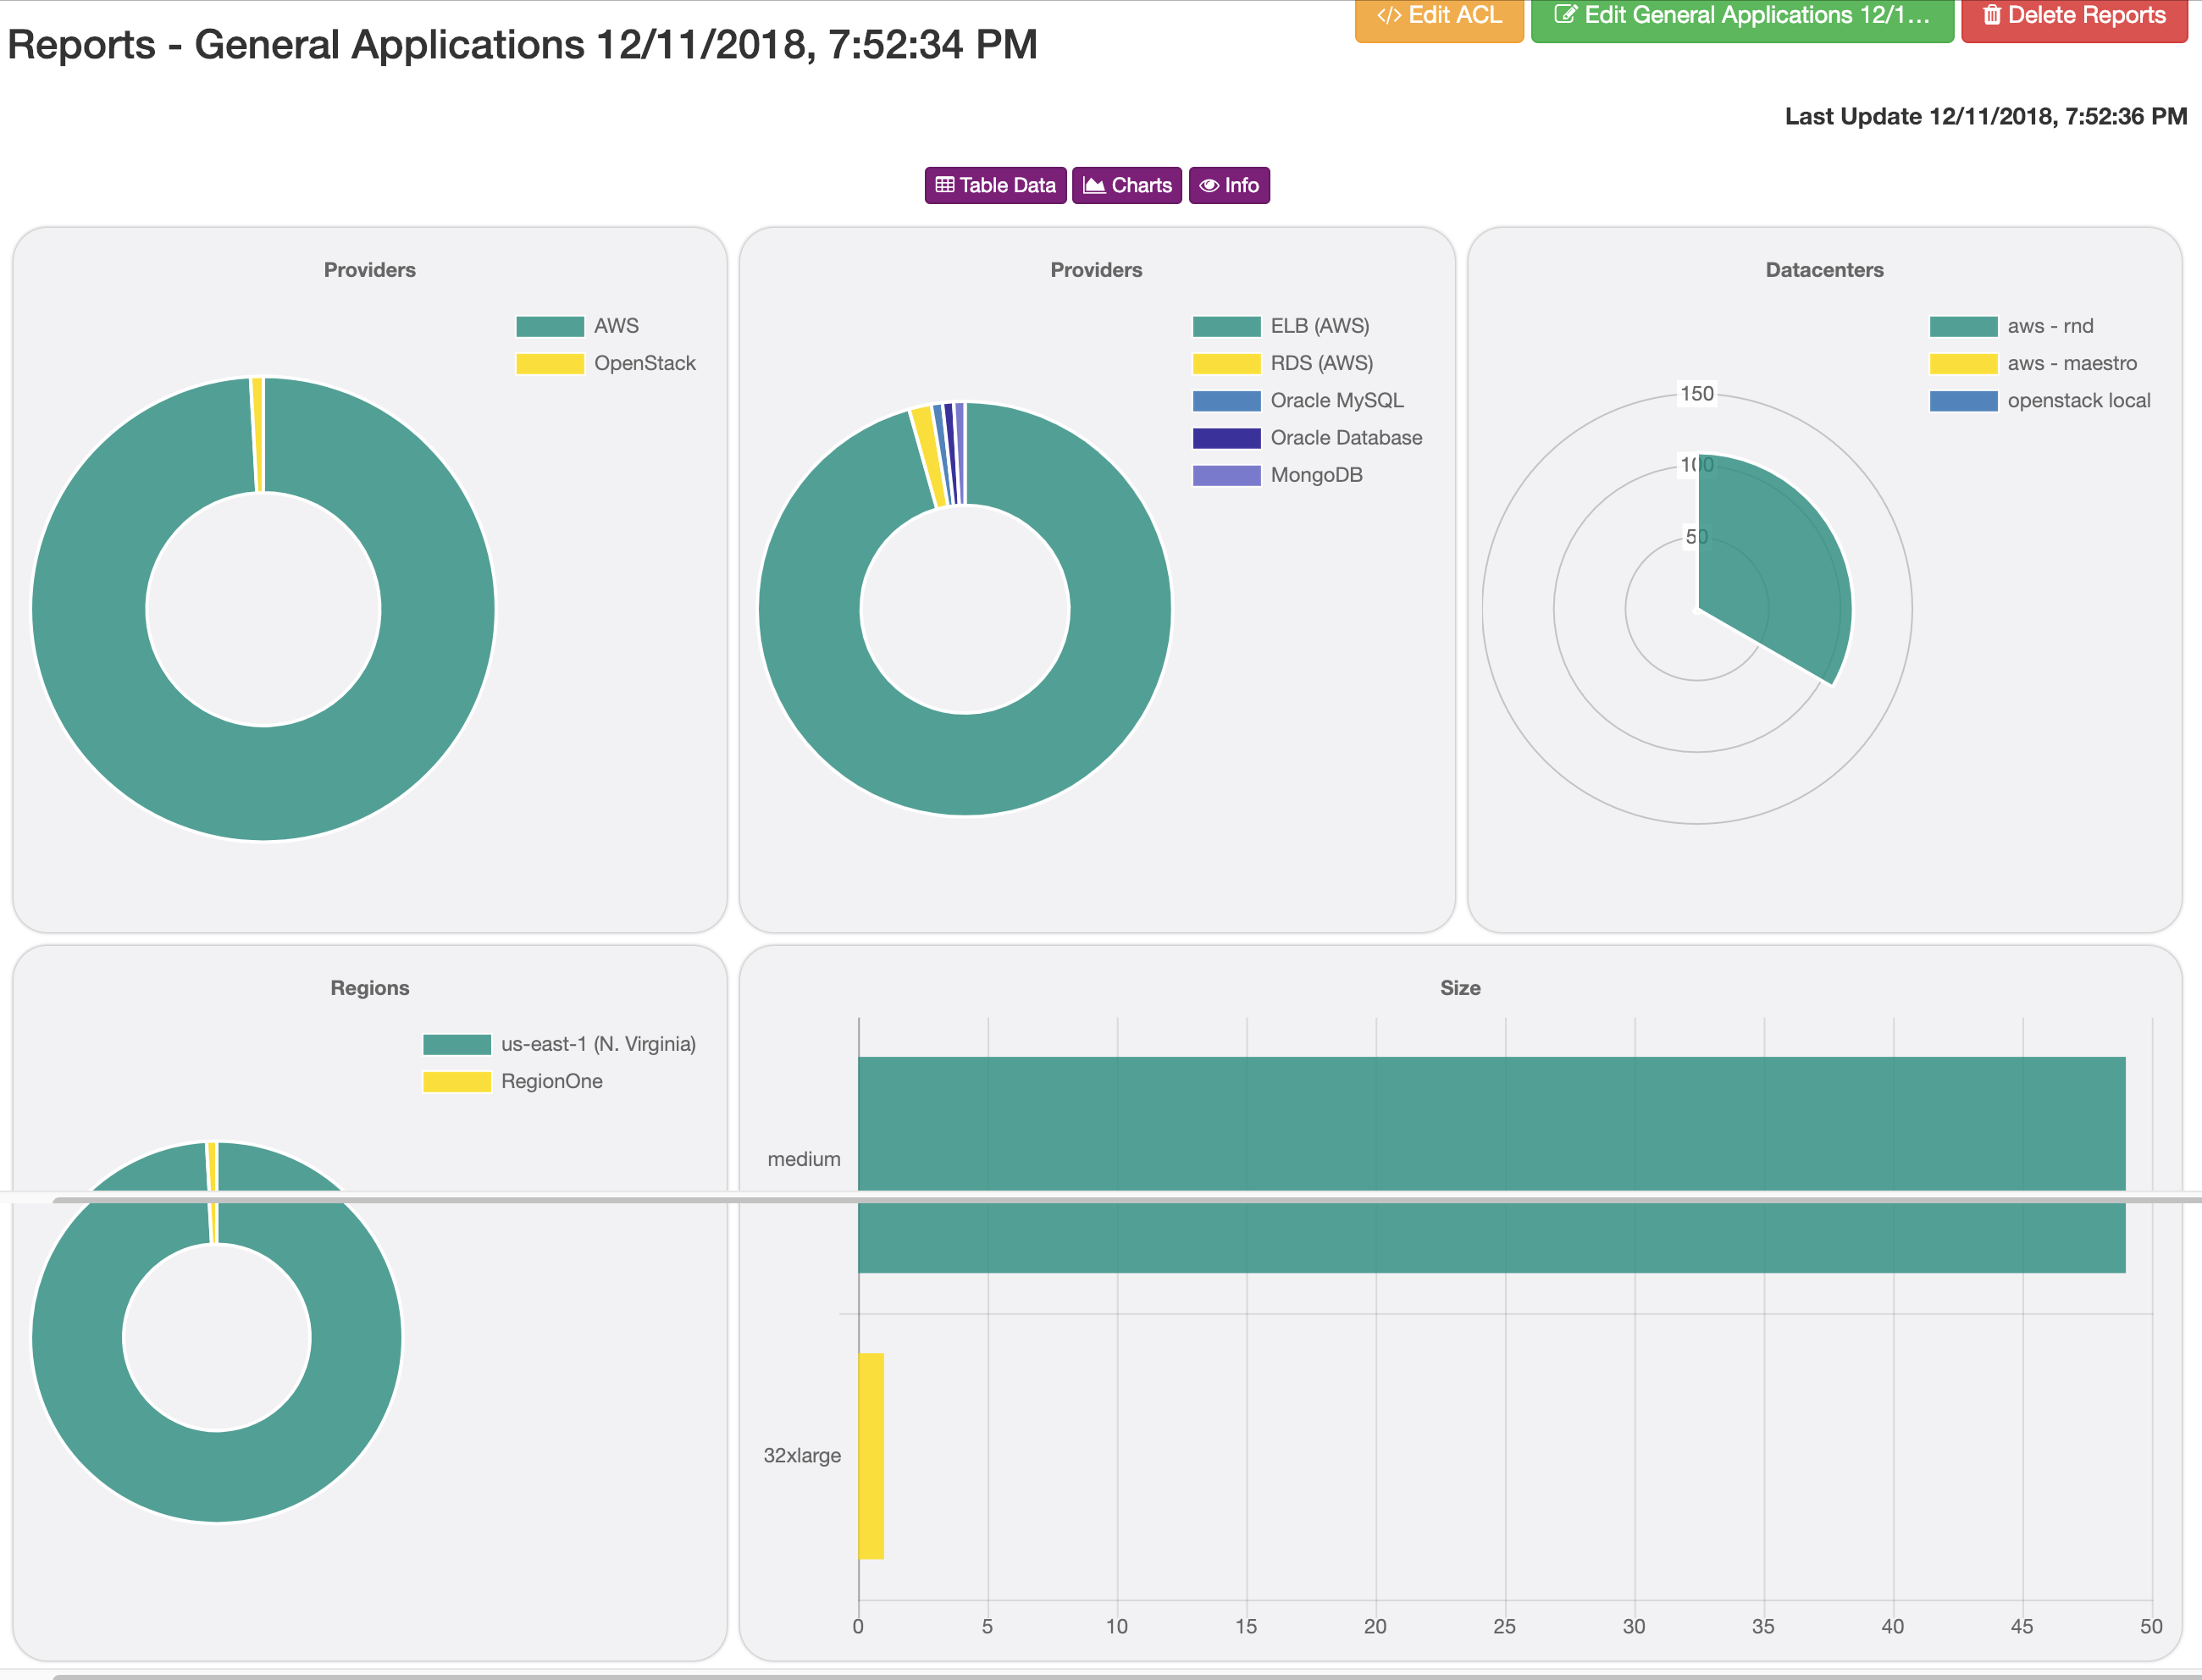
Applications charts
Aggregate fields:
- Datacenter - Providers
- Datacenter - Resource
- Datacenter - Instance type
- Datacenter - Regions
- Datacenter - Zones
- Tags
- Sizes
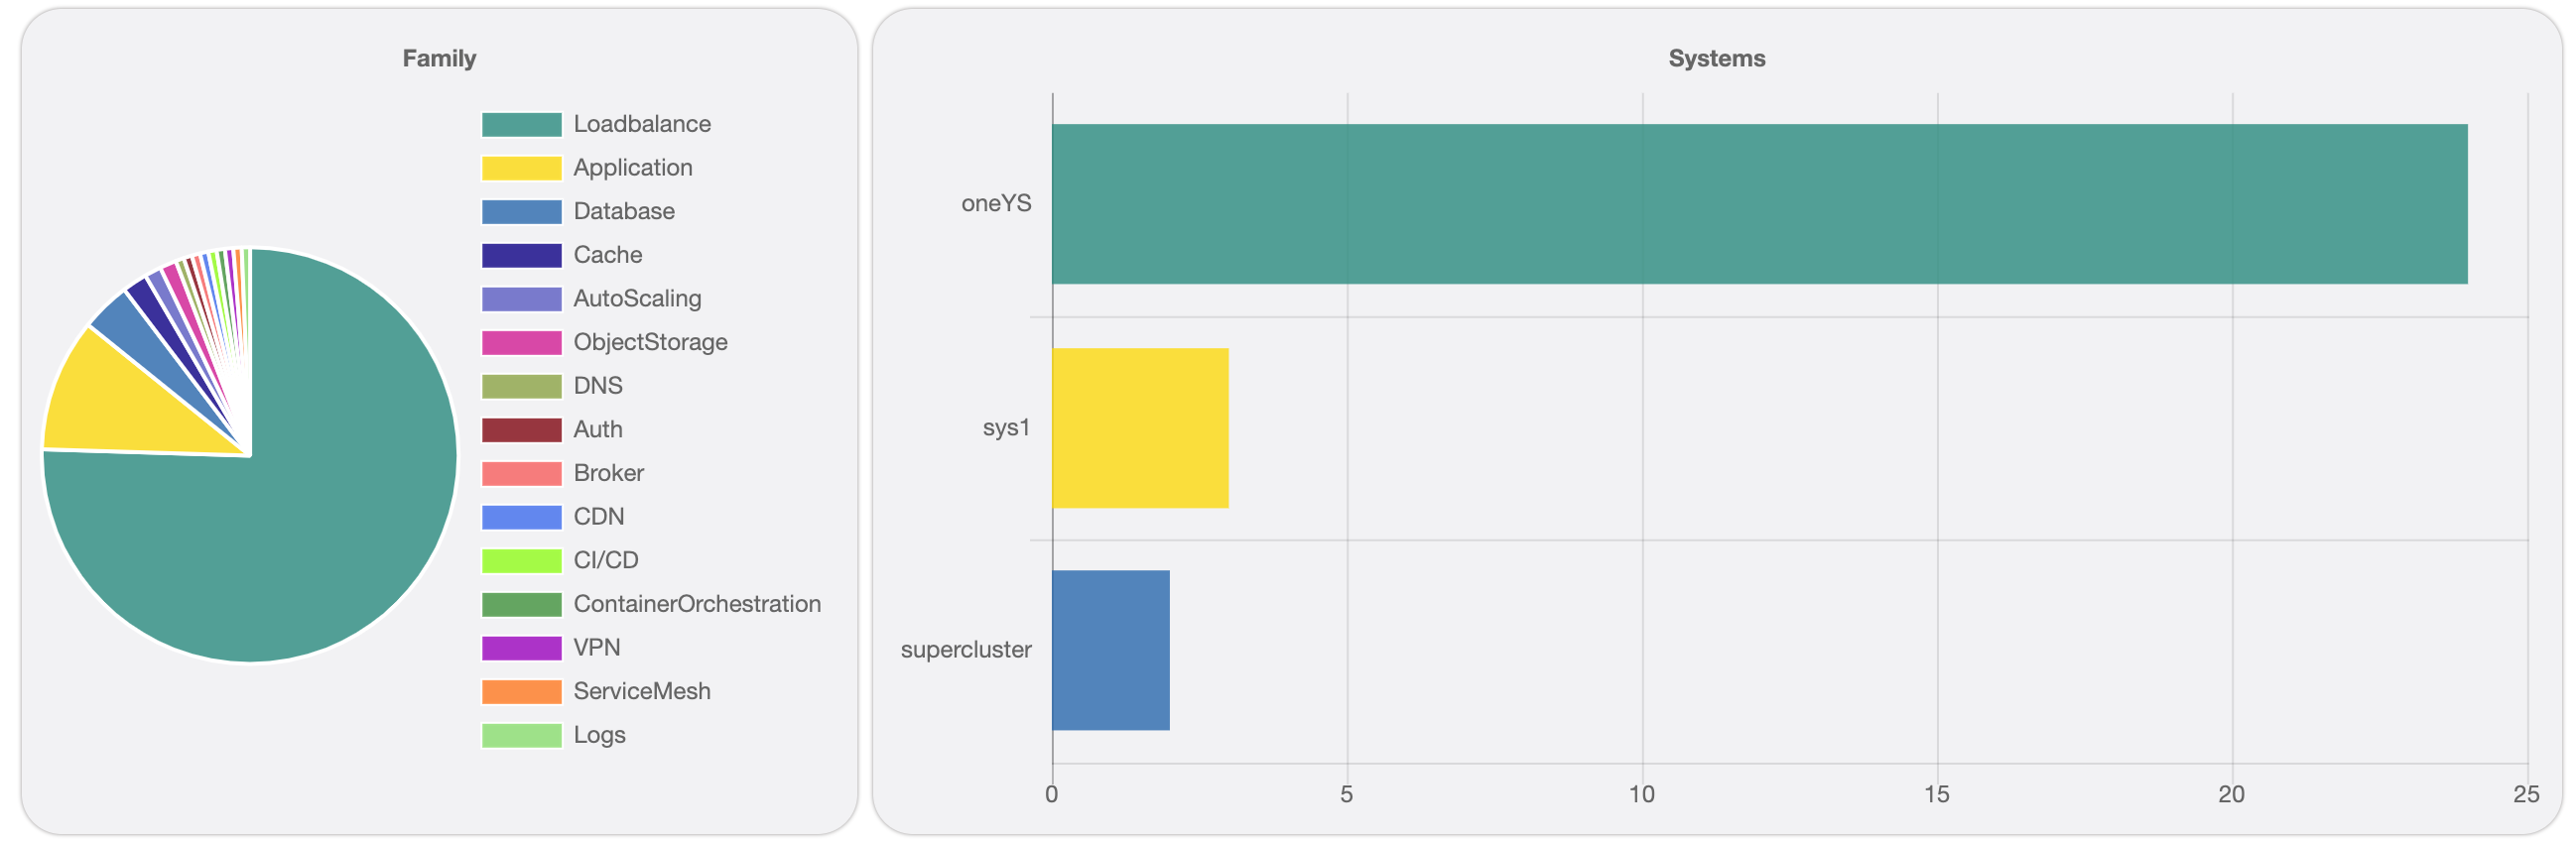
- Application - Family
- Application - Dependencies
- Application - Deploys
- System by Application
- Clients by System
- System - Entry Applications